

On this page
- The Max Connections Trap
- How Postgres Handles Connections
- The Restaurant Analogy
- CPU Contention & Context Switching
- Concurrency vs Throughput
- The Memory & work_mem Danger
- Autoscaling Connection Explosions
- The Solution: Connection Pooling
- Users ≠ Database Connections
- Pooling Provides Backpressure
- Enter PgBouncer
- Diagnosing Connection Exhaustion
- The Golden Rule of DB Scaling
The Max Connections Trap
01
Notes
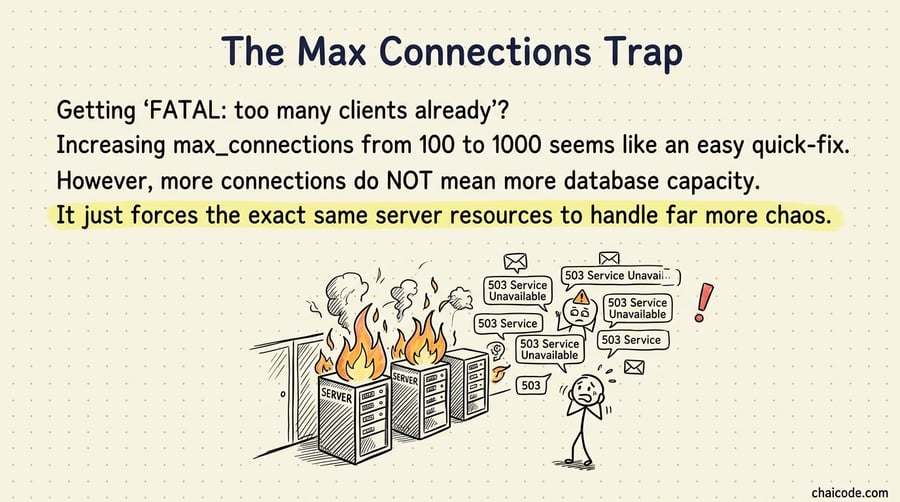
Getting 'FATAL: too many clients already'?
Increasing max_connections from 100 to 1000 seems like an easy quick-fix.
However, more connections do NOT mean more database capacity.
It just forces the exact same server resources to handle far more chaos.
How Postgres Handles Connections
02
Notes
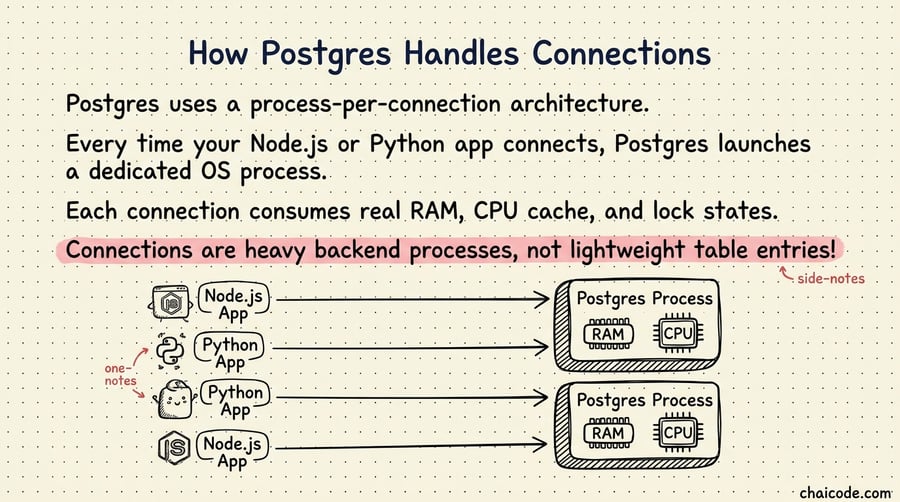
Postgres uses a process-per-connection architecture.
Every time your Node.js or Python app connects, Postgres launches a dedicated OS process.
Each connection consumes real RAM, CPU cache, and lock states.
Connections are heavy backend processes, not lightweight table entries!
The Restaurant Analogy
03
Notes
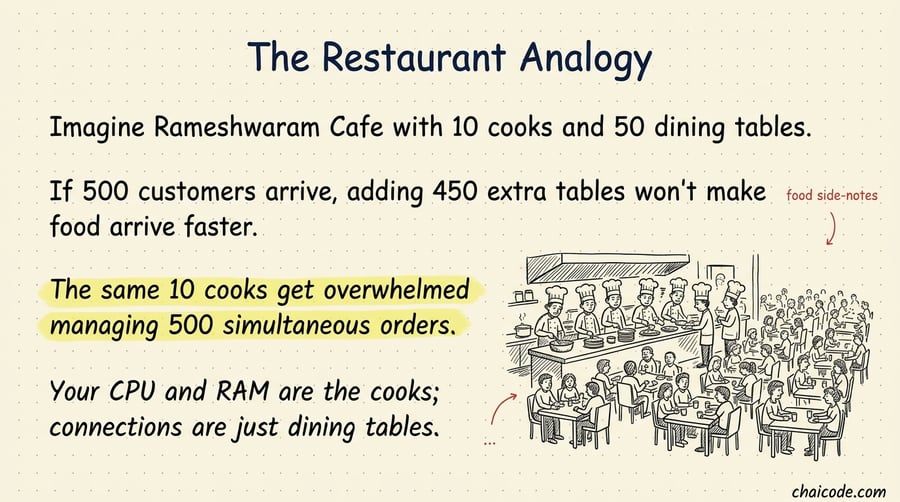
Imagine Rameshwaram Cafe with 10 cooks and 50 dining tables.
If 500 customers arrive, adding 450 extra tables won't make food arrive faster.
The same 10 cooks get overwhelmed managing 500 simultaneous orders.
Your CPU and RAM are the cooks; connections are just dining tables.
CPU Contention & Context Switching
04
Notes
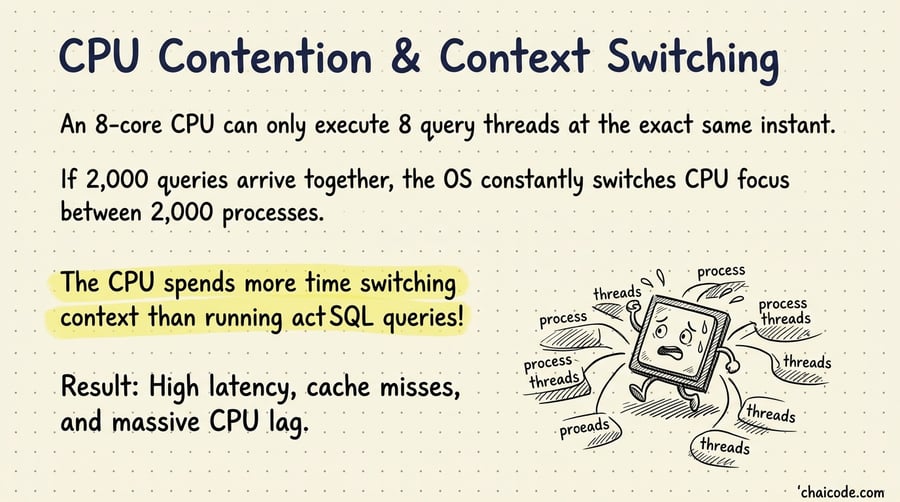
An 8-core CPU can only execute 8 query threads at the exact same instant.
If 2,000 queries arrive together, the OS constantly switches CPU focus between 2,000 processes.
The CPU spends more time switching context than running actual SQL queries!
Result: High latency, cache misses, and massive CPU lag.
Concurrency vs Throughput
05
Notes
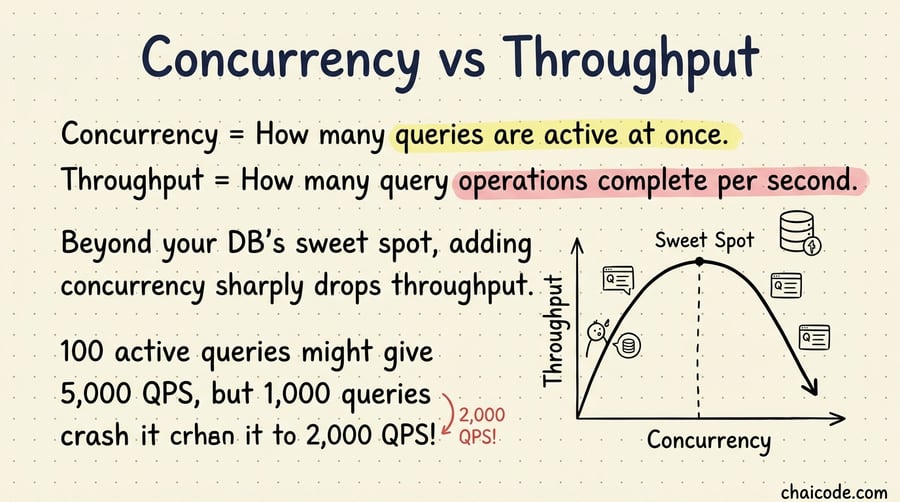
Concurrency = How many queries are active at once.
Throughput = How many query operations complete per second.
Beyond your DB's sweet spot, adding concurrency sharply drops throughput.
100 active queries might give 5,000 QPS, but 1,000 queries might crash it to 2,000 QPS!
The Memory & work_mem Danger
06
Notes
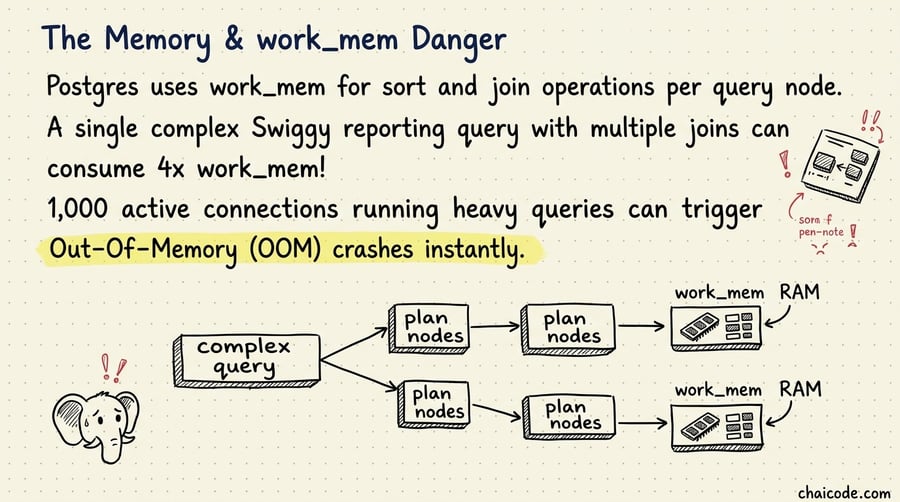
Postgres uses work_mem for sort and join operations per query node.
A single complex Swiggy reporting query with multiple joins can consume 4x work_mem!
1,000 active connections running heavy queries can trigger Out-Of-Memory (OOM) crashes instantly.
Autoscaling Connection Explosions
07
Notes
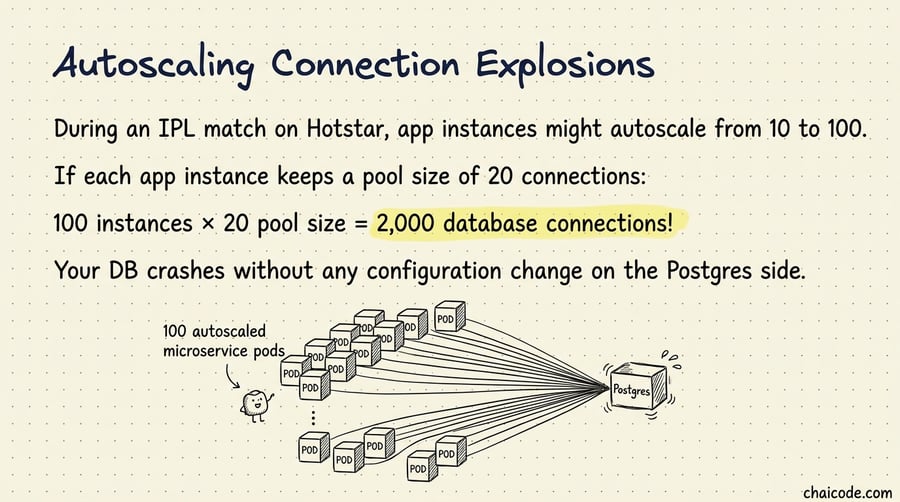
During an IPL match on Hotstar, app instances might autoscale from 10 to 100.
If each app instance keeps a pool size of 20 connections:
100 instances × 20 pool size = 2,000 database connections!
Your DB crashes without any configuration change on the Postgres side.
The Solution: Connection Pooling
08
Notes
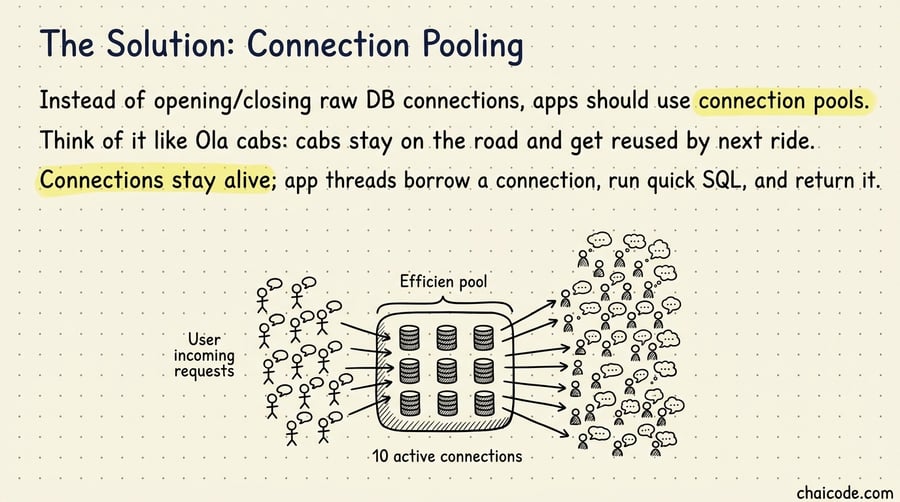
Instead of opening/closing raw DB connections, apps should use connection pools.
Think of it like Ola cabs: cabs stay on the road and get reused by next ride.
Connections stay alive; app threads borrow a connection, run quick SQL, and return it.
Users ≠ Database Connections
09
Notes
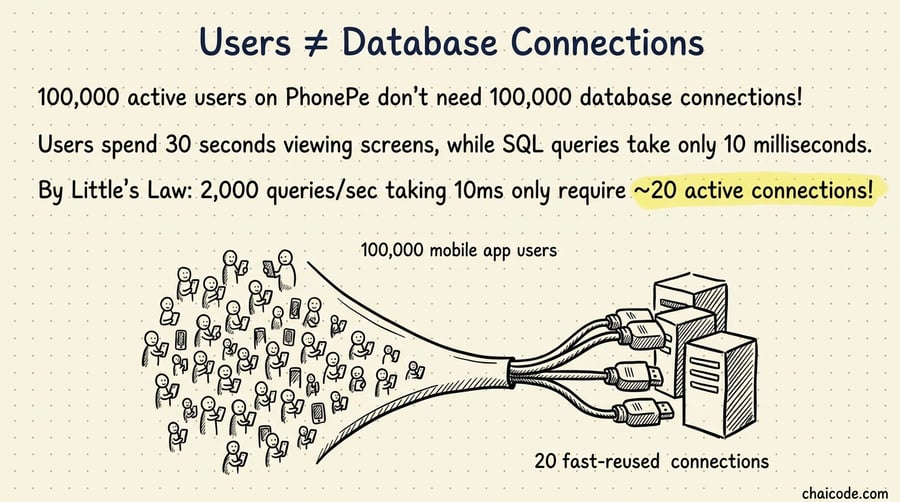
100,000 active users on PhonePe don't need 100,000 database connections!
Users spend 30 seconds viewing screens, while SQL queries take only 10 milliseconds.
By Little's Law: 2,000 queries/sec taking 10ms only require ~20 active connections!
Pooling Provides Backpressure
10
Notes
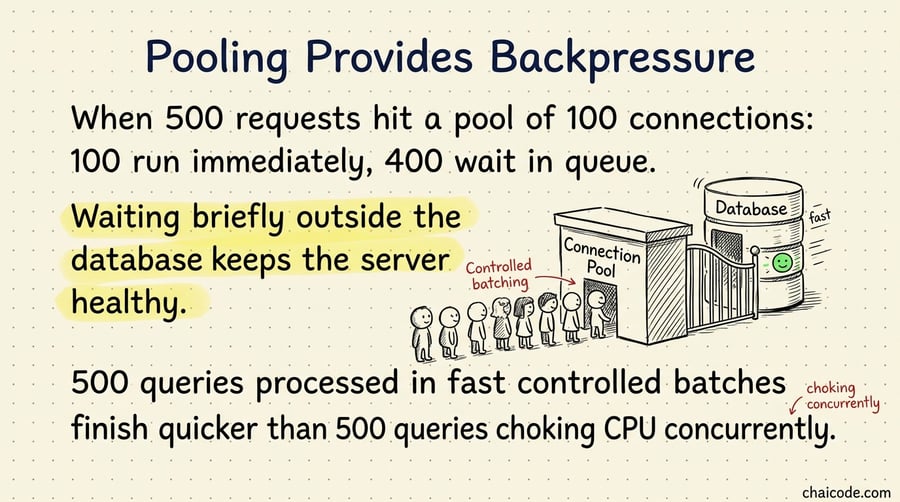
When 500 requests hit a pool of 100 connections: 100 run immediately, 400 wait in queue.
Waiting briefly outside the database keeps the server healthy.
500 queries processed in fast controlled batches finish quicker than 500 queries choking CPU concurrently.
Enter PgBouncer
11
Notes
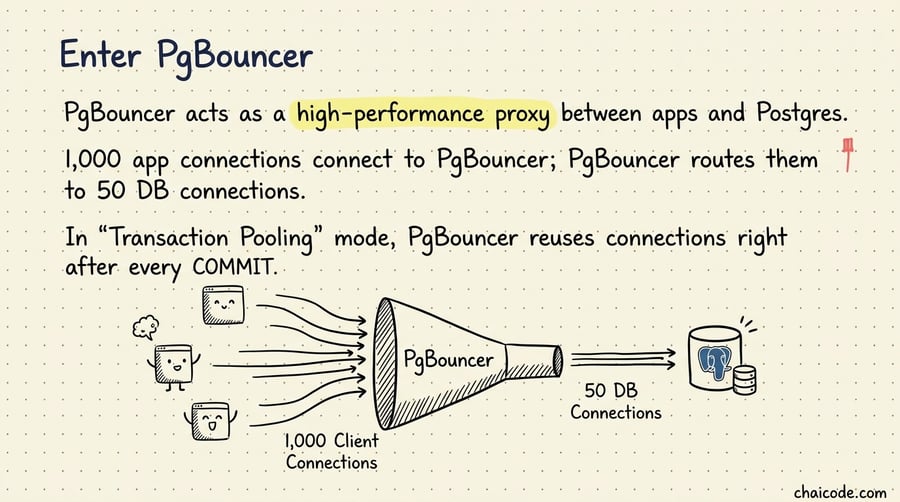
PgBouncer acts as a high-performance proxy between apps and Postgres.
1,000 app connections connect to PgBouncer; PgBouncer routes them to 50 DB connections.
In 'Transaction Pooling' mode, PgBouncer reuses connections right after every COMMIT.
Diagnosing Connection Exhaustion
12
Notes
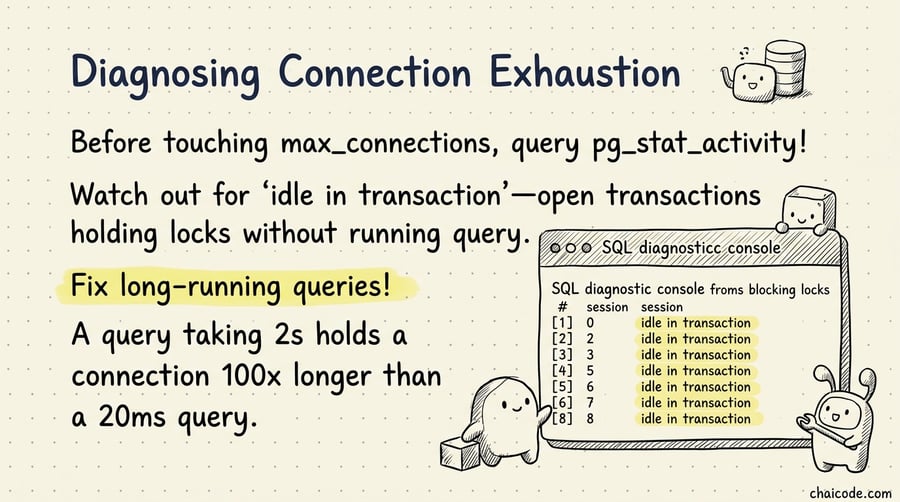
Before touching max_connections, query pg_stat_activity!
Watch out for 'idle in transaction'—open transactions holding locks without running query.
Fix long-running queries! A query taking 2s holds a connection 100x longer than a 20ms query.
The Golden Rule of DB Scaling
13
Notes
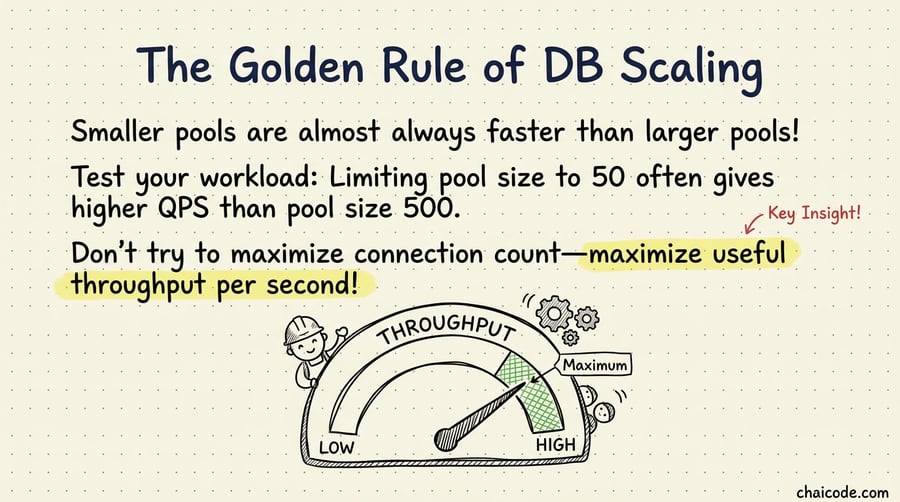
Smaller pools are almost always faster than larger pools!
Test your workload: Limiting pool size to 50 often gives higher QPS than pool size 500.
Don't try to maximize connection count—maximize useful throughput per second!